# Technical Analysis
- Only looks at historical price and volume
- Compute statistics called indicators
- Believed might work since there is information in price and heuristics work
# Effective Technical Analysis
- Individual indicators are weak, so combinations are desired
- Look for contrats (stock vs market)
- Work better in shorter time periods
# Terms
# Support
Support occurs where a downtrend is expected to pause due to a concentration of demand.
Think of it as the floor.

# Resistance
Resistance occurs where an uptrend is expected to pause temporarily, due to a concentration of supply. Think of it as the ceiling

# Highs & Lows

# Candlesticks

# Candlestick Patterns
# 38.2% Candle

Identifying: Use the fibonacci retracement to validate that the candle body is within 38.2%. For the downtrend candle, reverse the fibonacci retracement and the body of red candle should fall within the 38.2%.
The green candle shows us that the price moved all the way down (indicated by wicks), but buyers came in and pushed the closing price high (indicated by the green candle body).
- Indication of demand, and a bullish sign
- If this appears during a downtrend, it might be a sign of reversal
- if this appears during an uptrend, can serve as a confirmation for continuation
The red candle shows us that the price moved all the way up (indicated by wicks), but the selling pushed the closing price low (indicated by the red candle body)
- Indication of a selling pressure, and a bearish sign.
- If this appears at the top of an uptrend, it might be sign of a reversal
- If it appears during a downtrend, it might be a sign of continuation of the trend.
# Engulfing Candle

Identifying:
- Different color than the previous candle
- Has a larger body than the previous candle
- In the picture above where the engulfing candle is green, it is a bullish sign. If the engulfing sign was red, it would be a bearish sign
# Close above/below Candle

Close-below candle: A candle in which the close of that candle is below the low of the previous candle. This shows selling pressure, bearish sign.
Close-above candle: A candle in which the close of that candle is above the high of the previous candle. This shows buying demand, bullish sign.
# Trends

# Uptrend (Bullish)
Once the new higher high is reached (Impulsive move) pt.1, the market pulls back. When another higher highs (impulsive move) pt.3 is reached, then we have to make sure the market keeps trading above the lowest low point of the pullback pt.2 between pt.1 and pt.3. As long as this happens, we are in an UPTREND. When a new impulsive move is seen trading higher than the new higher high, continue this cycle to create the trend graph.
# Downtrend (Bearish)
Once the new lower low is reached (Impulsive move) pt1, the market pulls back high. Wehen another lower lows (impulsive move) pt.3 is reached, then we have to make sure the marke keeps trading lower than the highest high point of the pullback pt.2 between pt.1 and pt.3. As long as this happens, we are in a DOWNTREND. When a new impulsive move is seen trading lower than the new lower lows, continue this cycle to create trend graph.
# Strategies
# Break & retest strategy
A break and retest strategy happens when an asset makes a bullish or bearish breakout and then retests the previous resistance or support and then continues moving in the original trend.

# Key Indicators
# Average True Range (ATR)
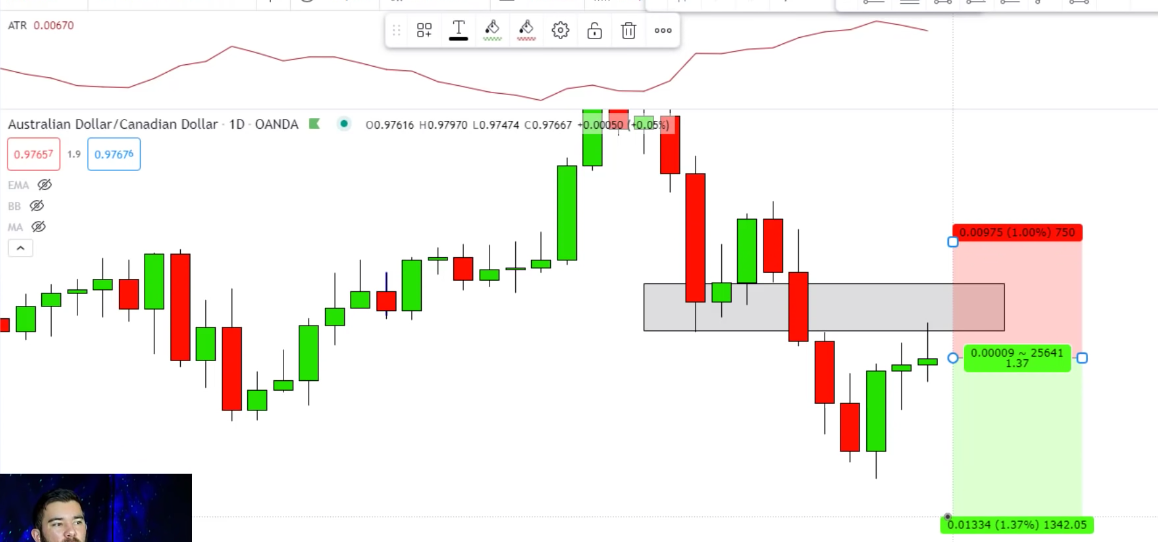
In the example above, we are looking at a bearish market, and setting up positions for a short sell (price decrease is the target, so think inverted)
Simply, we set up the target such that is 2x the ATR (2 x 0067 = 0.01334 pip) from current point. We set up the stoploss with (1x ATR + swing high (swing low if bullish) = 0.00975). This gives us a 1.38:1 reward-risk ratio.
# Moving Averages
- To define trends
- UPTREND: If price is trading above short-term (e.g. 20) moving average
- DOWNTREND: If price is trading below short-term (e.g. 20) moving average
- Area of value
- 20, 50 and 200 moving averages to identify areas of support and resistance
- Can be used to define trailing stop in uptrend market
# Relative strength index (RSI)
RSI is mostly used to help traders identify momentum, market conditions and warning signals for dangerous price movements. RSI is expressed as a figure between 0 and 100. An asset around the 70 level is often considered overbought, while an asset at or near 30 is often considered oversold.
RSI Divergence: When the price is making higher highs, and the RSI is making lower lows, RSI can serve a useful factor to identify reversals.

# Chart Patterns
# Double Bottoms

How to use
- Place a rectangle as shown below when you notice a low point (
bottom 1). The rectangle should extend through the wick. - Check if that point is retested by market by another candle closing on that rectangle (
bottom 2). Touching the rectangle any way is fine except when the candle's body extends below the rectangle. - Once the candles start climbing again and surpass the
neckline, a double bottom is confirmed. - This is where most traders enter buying position, but a better way recommended by
The Trading Channelis to wait for the market to pull back to the neckline. Once this happens, wait for the buying candle, and enter buy position.

# Double Tops

# Breakout Patterns
When the market goes from a low period of volatility to a higher period of volatility
# Time Frames
Remember, how data is viewed doesn't change how volatile a market is—all that changes is how much information you see.
# 15-Min
Most popular interval for day traders focusing on multiple stocks throughout the day
# Multiple
Best if done right.
If you're trading a double bottoms (bullish) on hourly time-frames, make sure you also look at the daily timeframe chart to verify, it shows we are on an uptrend. Verifying trends across multiple time-frames can be a good way to make accurate decisions.
Reviewing longer-term charts can help traders to confirm their hypotheses but, more importantly, it can also warn traders of when the separate time frames are in disaccord. By using narrower time frames, traders can also greatly improve on their entries and exits.
# LONG Strategy Cheatsheet
- Verify the market is up
- Look at moving averages to confirm this trend
- (e.g. market is above 20-day MA, we're in highly volatile up trend)
- Previous resistance is likely to become support, watch out
- Use break & test strategy to identify entry position
- Re-affirm current market behavior with candle stick patterns
- Look at RSI divergence to see for potential reversal
- Maybe look at other indicators like MACD? (not verified)
- Use ATR to identify stoploss, target price, and risk ratio
- Enter position by specifiying stoploss and target price for limit sell
# SHORT Strategy Cheatsheet
- Can use the
long strategywith mods for bearish market - Skip bearish trading for now until mastering a bullish market
# IGNORE NOTES BELOW
# Other Indicators
SMA (for long term)
RSI as Momentum Indicator (Understanding strengths of directions by finding out if something is overbought-undersold)
Bollinger Bands as Mean Reversion Indicator / Volatility Indicator
MACD as Trend Indicator
On Balance Volume Indicator as Volume Indicator
VWAP as Volume Indicator
EMA (for short term) as Trend Indicator - 50-Day EMA and 200-Day EMA
# Simple Moving average (SMA)
50- day, 200-day are some good long-term trend indicators.
# Exponential moving average (EMA)
Unlike the SMA, it places a greater weight on recent data points, making data more responsive to new information.
The most popular exponential moving averages are 12- and 26-day EMAs for short-term averages, whereas the 50- and 200-day EMAs are used as long-term trend indicators.
# Stochastic oscillator
A stochastic oscillator is an indicator that compares a specific closing price of an asset to a range of its prices over time – showing momentum and trend strength. It uses a scale of 0 to 100. A reading below 20 generally represents an oversold market and a reading above 80 an overbought market. However, if a strong trend is present, a correction or rally will not necessarily ensue.
# Moving average convergence divergence (MACD)
MACD is an indicator that detects changes in momentum by comparing two moving averages. It can help traders identify possible buy and sell opportunities around support and resistance levels.
MACD line is the difference between the 12 and 26-period moving averages. Signal line is the moving average of the MACD line. Quite naturally, the signal line smoothens the MACD line.
When a new trend occurs, the faster line (MACD line) will react first and eventually cross the slower line (Signal Line). When this "crossover" occurs, and the fast line starts to "diverge" or move away from the slower line, it often indicates that a new trend has formed.
If the MACD line crosses the signal line from above, and continues to go below signal line, that is an indication of a downtrend. If the MACD line crosses the signal line from below, and continues to go above the signal line, that is an indication of an uptrend.
# Bollinger bands
A Bollinger band is an indicator that provides a range within which the price of an asset typically trades. The width of the band increases and decreases to reflect recent volatility.
Implementation
Ratio of how much it goes up on days it goes up / how much it goes down on days it goes down
Normalize the ratio on a scale of 100
An overbought signal suggests that short-term gains may be reaching a point of maturity and assets may be in for a price correction. In contrast, an oversold signal could mean that short-term declines are reaching maturity and assets may be in for a rally.
# Volume weighted average price (VWAP)
The average price a security has traded at throughout the day, based on both volume and price. It is important because it provides traders with insight into both the trend and value of a security.
To identify if the market is bullish or bearish and if it is a good time to buy/sell
# On-Balance Volume (OBV)
On-balance volume (OBV) is a technical trading momentum indicator that uses volume flow to predict changes in stock price.
# Standard Deviation (Volatility)
Standard deviation is an indicator that helps traders measure the size of price moves.
# Average directional index (ADX)
The ADX illustrates the strength of a price trend. It works on a scale of 0 to 100, where a reading of more than 25 is considered a strong trend, and a number below 25 is considered a drift. Traders can use this information to gather whether an upward or downward trend is likely to continue.
# Ascending triangle
An ascending triangle is generally considered to be a continuation pattern, meaning that the pattern is significant if it occurs within an uptrend or downtrend. Once the breakout from the triangle occurs, traders tend to aggressively buy or sell the asset depending on which direction the price broke out. An ascending triangle is tradable in that it provides a clear entry point, profit target, and stop loss level.
# Three black crows
Three black crows is a phrase used to describe a bearish candlestick pattern that may predict the reversal of an uptrend.
# Ill-informed Strategy Cheatsheet
# Indicators
- Momentum Oscillator: % B
- Momentum Indicator: RSI
- Trend Indicator: MACD
- Price-Volume Indicator: Force Index
- Volatility Indicator: Z score
# Buy signals
- % B < 20 (oversold)
- RSI < 30 (oversold)
- MACD (if MACD line crosses signal line from below, watch out, might be potential uptrend)
- Force Index < 0 (confirms falling prices) DON'T USE YET
- abs Z score < 2
# Sell signals
- % B > 80 (overbought)
- RSI > 70 (overbought)
- MACD (if MACD line crosses signal line from above, watch out, might be potential downtrend)
- Force Index > 0 (confirms rising prices) DON'T USE YET